![]()
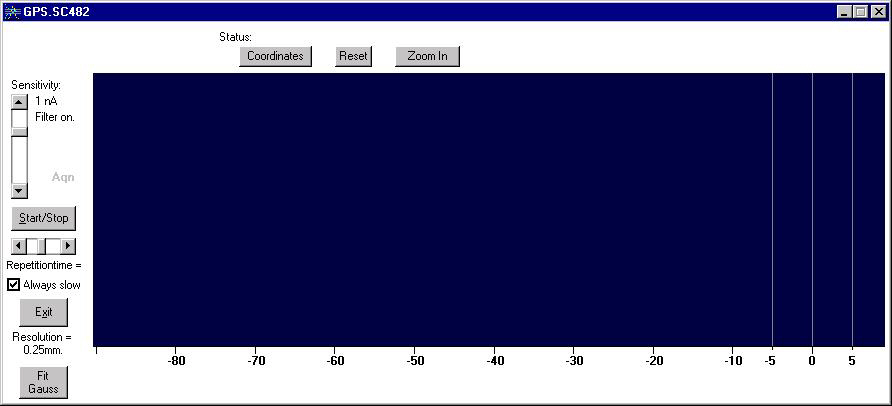
| Open the Isolde Controls file in the Isolde Control System directory. Choose the tool named Easy Eqp. Access. Enter gps.sc482 in the Equipment Name dialog box. Press the Attach Control Pannel button. The GPS.SC482 will appear. It looks like the box below: |

| Choose the atom you want to have with the Mass Control tool GPS.MAG70 Mass Control.Let us suppose that you have chosen the 132Xe (xenon 132).. | |
| Press the Start/stop button on the GPS.SC482. You will see the curves representing the beam profiles (taken horizontally) of the different isotopes of the species you have chosen with the Mass Control tool (xenon in our example). Note that in fact in our example we just asked to have the 132Xe. The corresponding curve will be the biggest one almost centered at 0 (as a horizontal coordinate). But you will see several other curves corresponding in our example to 130Xe and 131Xe for instance. If you look from left to right, you will see curves, the corresponding mass of which are increasing. If you want to get rid of the neighbouring curves of the one representing the isotope you wished, 132Xe in our example, press the Slit button on the Wire Grid tool GPS.WG475. | |
| You can play on the sensitivity button to improve the appearance of your curves. |
| Back to top |
![]()